More systems to maintain.
CRM hygiene, recording permissions, forecast mappings and sequence upkeep compete for RevOps time.
Revenue teams have spent more on technology, and warning signs still show up too late to act on. Compare your team to what 500 US revenue leaders say about the cost, and what they want instead.

"Every tool we added meant more fragmentation and a bigger bill, not better decisions."

01 / SIZE YOUR CONTEXT GAP
ANNUAL DEAL VALUE WHERE EARLIER CONTEXT WOULD HELP
$1,250,000100 deals / year × 25% × $50,000
No email needed to see your estimate.
02 / EXPLORE THE OPPORTUNITY
Choose an outcome. Scope your Challenge.
Of the deals where earlier context would help, estimate the share your team would turn into additional wins.
Compare your baseline with the same additional-win scenario across your annual deal volume.
Explore a shorter sales cycle. Earlier timing is separate from additional wins and contract value.
POTENTIAL ADDITIONAL DEAL VALUE
$250,0005 modeled additional wins per year
20% of helpful-context deals assumed to become additional wins
SCENARIO WIN RATE
65%60% baseline 65% scenario
Same deal volume. 5 modeled additional wins. This is the same scenario as the deal-value view.
POTENTIAL TIME TO CLOSE
15 days sooner180 days today 165 days target
8.33% shorter cycle. Timing only, not incremental revenue.
An editable planning assumption. No measured SciFin conversion rate is implied.
03 / The sales team's missing context
64.8% increased revenue-system spending.
34.2% Earlier risk identification. The most-selected improvement leaders wanted from their revenue systems.
From the SciFin researchEstimated annual license spend
$148,500$5,940 per rep / year
One paid seat per rep in each selected category. Changing team size scales the annual budgets.
Estimate annual costs.
Maintain data hygiene, permissions and integrations.
$195.00 / rep / month · Annual license budget
Manage recording permissions, retention and coaching access.
$100.00 / rep / month · Annual license budget
Reconcile CRM fields, forecast rules and review cadences.
$75.00 / rep / month · Annual license budget
Maintain sequences, mailbox access and deliverability.
$125.00 / rep / month · Annual license budget
QUESTIONS YOUR SALES TEAM STILL NEEDS TO ANSWER
CRM hygiene, recording permissions, forecast mappings and sequence upkeep compete for RevOps time.
Review data access, security, API limits and overlapping features for each tool before signing.
Audit active seats, adoption and duplicate capabilities before each renewal. Recheck platform fees and usage charges.
The example supports 25 sales reps with four separate tools. CRM starts at Salesforce Core’s $195 per user per month, billed annually. Conversation AI ($100), forecasting ($75) and engagement ($125) are monthly per-rep planning assumptions, not vendor quotes. Annual costs remain editable. For bundled products, enter only incremental costs.
License totals exclude implementation, platform fees, usage charges, tax and staff time. Gong charges per user plus a platform fee. Outreach combines seats and AI usage. Confirm the full contract scope and renewal terms with each vendor.
Salesforce pricing ↗Gong pricing ↗Clari / Salesloft quote ↗Outreach pricing ↗
Pricing reviewed October 21, 2026.
Get your personalized findings and the research behind the context gap.
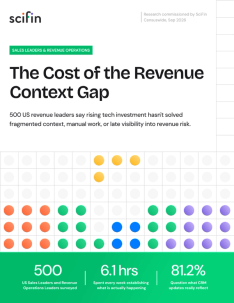
The Cost of the Revenue Context Gap
September 2026Keep your copy. Bring these assumptions to your next pipeline review.
READY FOR YOUR NEXT PIPELINE REVIEW
Download your calculator results and the Cost of the Revenue Context Gap report below.
Explore SciFinYour findings are ready to download. No email delivery is promised.
SciFin commissioned Censuswide to survey 500 US sales and revenue operations leaders in September 2026. Findings are self-reported. Calculator assumptions are independent of the survey percentages. Read the research
A typical deal-range value × annual qualified deals × estimated share where earlier executive buyer input or deal-stoppage information would help. This is potential influenced deal value.
Helpful-context deals × assumed additional-win share. Additional wins are capped at annual deals not already won in the baseline scenario. Additional wins × average deal size gives potential additional deal value.
Baseline wins = annual deals × baseline win rate. Scenario win rate = (baseline wins + additional wins) ÷ annual deals. Velocity = current cycle minus target cycle, with each cycle capped at 548 days.
These are planning estimates, not measured losses, guaranteed wins, or a SciFin performance claim. Fractional deal counts are expected values. Spending, timing, and deal value stay separate. Values use USD.